
I have been interested in learning Machine Learning for some time and wanted to apply it through a hands-on project. After exploring different ideas, I decided to build a sentiment analysis proof of concept capable of classifying movie reviews as either positive or negative.
My long-term goal is to develop a complete sentiment analysis solution using the Google Maps API to analyze restaurant reviews. However, before working with real-world data, I wanted to build a smaller proof of concept to understand the core concepts behind Natural Language Processing (NLP), TF-IDF vectorization, and Logistic Regression. This project served as a learning exercise and provided the foundation for the next stage of the project.

Throughout this article, I explain the complete workflow used to build the proof of concept, including data preparation, feature engineering with TF-IDF, model training using Logistic Regression, model evaluation, and the development of an interactive Tableau dashboard to visualize the results.
Project Resources
The complete project resources are available below:
- GitHub Repository – Contains the Python notebook, source code, and exported datasets.
- Interactive Tableau Dashboard – Explore the dashboard published on Tableau Public.
- Dataset – IMDb 50K Movie Reviews Dataset (Kaggle).
What I wanted to learn
Although this project is a sentiment analysis proof of concept, my primary objective was not to achieve the highest possible model accuracy. Instead, I wanted to understand the complete machine learning workflow behind a text classification problem and gain hands-on experience with the techniques commonly used in Natural Language Processing (NLP).
The learning objectives for this project were:
- Understand how a binary text classification problem is structured.
- Learn how TF-IDF transforms unstructured text into numerical features that a machine learning model can understand.
- Explore why Logistic Regression is commonly used as a baseline model for sentiment analysis.
- Train and evaluate a classification model using Python and Scikit-learn.
- Interpret evaluation metrics such as Accuracy, Precision, Recall, and the Confusion Matrix.
- Present the model results through an interactive Tableau dashboard.
Rather than treating this as a standalone project, I approached it as the foundation for a larger sentiment analysis solution using the Google Maps API. By understanding these core concepts first, I can focus on solving more complex real-world problems in future projects without treating the machine learning model as a «black box.»
Project Workflow
The diagram below summarizes the complete workflow used throughout this project.
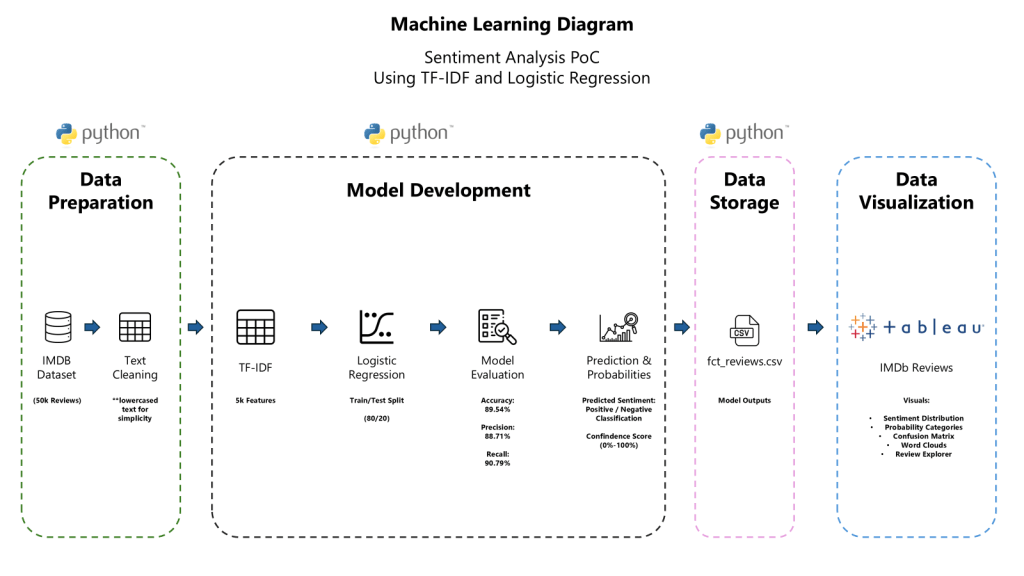
The project follows an end-to-end machine learning workflow. Movie reviews are first cleaned and transformed into numerical features using TF-IDF vectorization. These features are then used to train a Logistic Regression classifier. After evaluating the model, the predictions and confidence scores are exported to CSV files, which serve as the data source for an interactive Tableau dashboard.
Technologies
The project combines Python for machine learning with Tableau for data visualization, creating an end-to-end workflow from raw text to interactive analytics.
- Python – Data preparation, feature engineering, model training, evaluation, and data export.
- Pandas – Data manipulation and preparation.
- Scikit-learn – TF-IDF vectorization, Logistic Regression, and model evaluation.
- CSV Files – Storage of model outputs for visualization.
- Tableau Public – Interactive dashboard development and result exploration.
Data Source
The dataset used in this project is the IMDb 50K Movie Reviews Dataset, available through Kaggle (link). It contains 50,000 manually labeled movie reviews, balanced dataset between positive and negative sentiment classes.
To evaluate the model, the dataset was divided using an 80/20 train-test split, resulting in:
- Training Set: 40,000 reviews
- Test Set: 10,000 reviews
Model Development
Feature Engineering with TF-IDF
Before a machine learning model can classify text, the review data must first be transformed into a numerical representation. Machine learning algorithms cannot interpret raw text directly; instead, they require numerical features that capture the importance of each word within a document.
To accomplish this, I used Term Frequency–Inverse Document Frequency (TF-IDF), one of the most common feature engineering techniques in Natural Language Processing (NLP). TF-IDF assigns a numerical weight to every word by considering two factors:
- How frequently the word appears in a specific document (Term Frequency).
- How rare the word is across the entire collection of documents (Inverse Document Frequency).
The result is a numerical feature matrix that can be used as the input for a machine learning model.
Term Frequency (TF): Term Frequency measures how often a term appears within a single document. Words that appear more frequently are generally considered more relevant to that particular review.
Inverse Document Frequency (IDF): Inverse Document Frequency measures how unique a word is across the entire dataset. Common words such as the, a, or movie appear in many reviews and therefore receive a lower weight, while rarer and more informative words receive a higher weight.
TF-IDF: The final TF-IDF score is obtained by multiplying the Term Frequency by the Inverse Document Frequency.
This transformation enables machine learning algorithms to process textual information by representing each review as a numerical feature vector.
For this proof of concept, I limited the TF-IDF vectorizer to the 5,000 most informative terms (max_features = 5000).
This value represents a practical balance between model performance and computational efficiency. Using significantly more features increases memory usage and training time while often providing only marginal improvements in evaluation metrics such as Accuracy, Precision, and Recall. This is a common example of the law of diminishing returns in machine learning.
Once the review text had been transformed into a numerical TF-IDF matrix, the resulting feature vectors became the input to the Logistic Regression model. The model then learned which words and combinations of words were more strongly associated with positive or negative sentiment.
Training a Logistic Regression Model
Since the objective of this project was to classify each movie review as either positive or negative, I selected Logistic Regression, a supervised machine learning algorithm widely used for binary classification problems.
Unlike linear regression, which predicts continuous numerical values, Logistic Regression estimates the probability that an observation belongs to a particular class. The output is always a value between 0 and 1, making it ideal for predicting one of two possible outcomes. During training, the algorithm learns a weight for each TF-IDF feature, allowing it to estimate whether certain words increase or decrease the probability of positive sentiment.
The Logistic Regression model uses the logistic (sigmoid) function to convert its output into a probability between 0 and 1. So for this project:
- A probability closer to 1 indicates a positive review.
- A probability closer to 0 indicates a negative review.
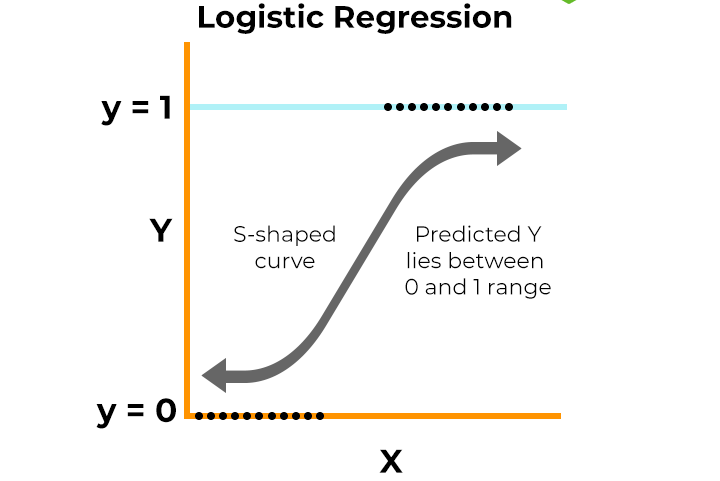
To train and evaluate the model, the dataset was divided into two subsets:
- Training Set (80%) – Used to learn the relationship between the TF-IDF features and the known sentiment labels.
- Test Set (20%) – Used to evaluate how well the trained model performs on previously unseen reviews.
By separating the data into training and testing sets, the evaluation metrics provide a more realistic estimate of how well the model can generalize to new, unseen reviews rather than simply memorizing the training data.
Model Evaluation
After training the Logistic Regression model, the next step was to evaluate how well it performed on the test dataset. Rather than relying on a single metric, classification models are typically assessed using multiple evaluation metrics, each providing a different perspective on model performance. Together, these metrics help determine not only how accurate the model is, but also how reliable its predictions are and how well it generalizes to previously unseen data.
Accuracy
Accuracy measures the overall percentage of correct predictions made by the model. It provides a general indication of model performance by comparing the number of correctly classified reviews against the total number of predictions. The classifier correctly predicted 89.54% of the reviews, meaning that nearly nine out of every ten reviews were classified correctly.
Precision
Precision measures how many reviews predicted as positive were actually positive.
A high precision indicates that when the model predicts a positive review, it is usually correct. This metric is particularly important in situations where false positive predictions are costly. Among the reviews predicted as positive, 88.72% reviews predicted as positive were actually positive.
Recall
Recall measures how many of the actual positive reviews were successfully identified by the model.
A high recall indicates that the model is able to identify most positive reviews while minimizing false negatives. This metric is especially useful when failing to detect a positive case is more critical than generating occasional false positives.
The model successfully identified 90.77% positive reviews in the test dataset. A high Recall reduces the number of false negatives, making it less likely that genuinely positive reviews are classified as negative.
Confusion Matrix
While Accuracy, Precision, and Recall summarize the model’s performance using aggregate metrics, the Confusion Matrix provides a detailed view of every prediction made by the classifier.
Every prediction made by the model belongs to one of four categories:
- True Positive (TP): Correctly predicted positive review.
- True Negative (TN): Correctly predicted negative review.
- False Positive (FP): Negative review incorrectly classified as positive.
- False Negative (FN): Positive review incorrectly classified as negative.
Analyzing these four outcomes helps identify where the model performs well and where prediction errors occur.
Prediction Confidence
In addition to predicting whether a review is positive or negative, the Logistic Regression model also estimates the probability associated with each prediction.
For this project, I defined a Prediction Confidence score as the probability associated with the predicted class. For example, if the model predicts a positive review with a probability of 96%, the prediction confidence is 96%. Likewise, if it predicts a negative review with a probability of 92%, the confidence is also 92%.
This metric provides additional insight into how certain the model is about each prediction. Combined with the evaluation metrics, it helps identify whether highly confident predictions are generally more accurate and highlights cases where the model is uncertain.
While these metrics provide a quantitative evaluation of the model, they do not always reveal how individual predictions behave. To explore the results in greater detail, I exported the prediction dataset into Tableau and developed an interactive dashboard that allows the model’s performance to be explored interactively and allows users to explore individual predictions, confidence levels, and evaluation metrics from multiple perspectives.
Data Visualization
Building an Interactive Tableau Dashboard
After evaluating the model in Python, I exported the prediction dataset into a structured CSV file and connected it to Tableau Public. Rather than analyzing the evaluation metrics through code alone, I wanted to build an interactive dashboard that would make it easier to explore the model’s behavior, identify prediction patterns, and understand where the classifier performs well or struggles.
Dashboard Objectives
The dashboard was designed to answer questions such as:
- How accurate is the model overall?
- Where does the model make prediction errors?
- How confident are the model’s predictions?
- Does higher prediction confidence correspond to higher accuracy?
- Which reviews were classified incorrectly?
Dashboard Overview
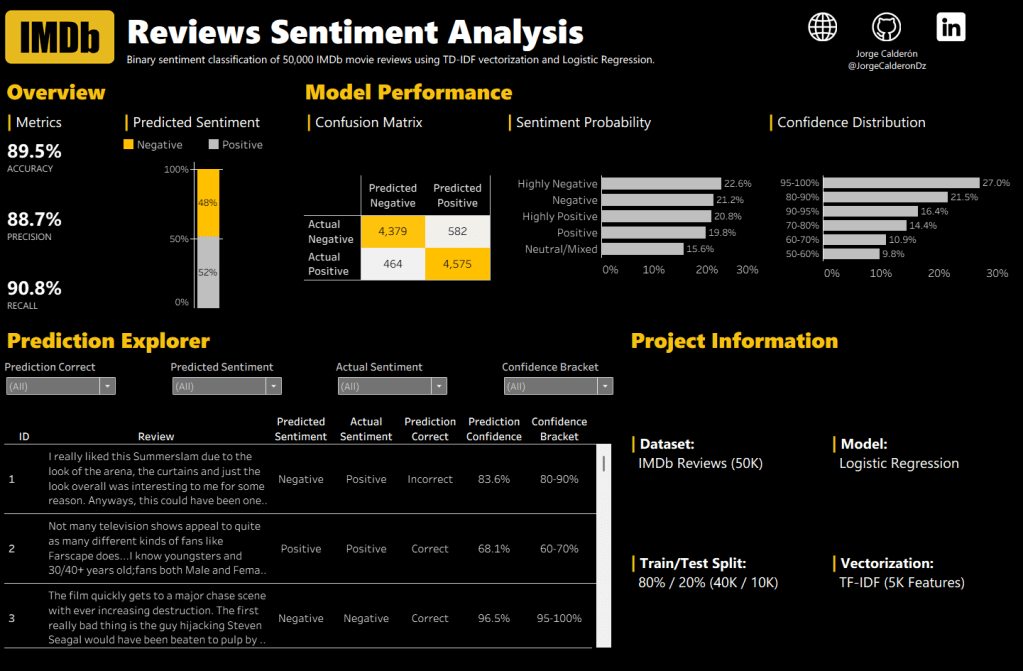
The dashboard combines the model evaluation metrics with interactive visualizations that allow users to explore the predictions from multiple perspectives. Filters make it possible to inspect specific sentiment categories, confidence levels, and prediction outcomes while maintaining an overview of the model’s overall performance.
The complete interactive dashboard is available on Tableau Public (Dashboard Link).
Key Components
Model Performance → How well does the model perform overall?
The Model Performance section summarizes the overall effectiveness of the Logistic Regression model through the primary classification metrics: Accuracy, Precision, and Recall. Together, these metrics provide a high-level view of the model’s predictive performance on the test dataset.
Prediction Analysis → How does the model behave?
The Prediction Analysis section provides a deeper understanding of how the model makes predictions. Visualizations such as the Confusion Matrix, Probability Matrix, and Prediction Confidence Distribution help identify prediction patterns, confidence levels, and the types of classification errors made by the model.
Prediction Explorer → Why did the model make a specific prediction?
The Prediction Explorer enables users to inspect individual predictions in detail. Interactive filters and a detailed review table allow exploration of the original review text alongside the actual sentiment, predicted sentiment, prediction confidence, and classification outcome, making it easier to investigate both correct predictions and misclassifications.
Why Tableau?
Separating the machine learning pipeline from the visualization layer provides several advantages. Python focuses on data preparation, feature engineering, model training, and evaluation, while Tableau specializes in interactive exploration and communication of results. This separation creates a modular workflow where the machine learning model and the dashboard can evolve independently.
Although these analyses could have been performed directly in Python, Tableau makes it easier to explore prediction behavior interactively through filters, drill-downs, and visual summaries.
What I Learned
Although this project began as a personal learning exercise, I quickly realized that understanding the concepts behind the machine learning workflow was more valuable than simply obtaining a prediction.
Throughout this proof of concept, I learned how TF-IDF transforms unstructured text into numerical features, why Logistic Regression is an effective baseline model for binary text classification, and how to evaluate a classification model using metrics such as Accuracy, Precision, Recall, and the Confusion Matrix. More importantly, I gained a better understanding of the reasoning behind each stage of the workflow rather than treating the model as a «black box.»
Documenting the project through this article helped reinforce those concepts while creating a reference that I can revisit as I continue learning machine learning and natural language processing.
Next Steps
Although this project was developed as a proof of concept, the same workflow can be applied to real-world sentiment analysis projects.
My next objective is to build a complete sentiment analysis solution using the Google Maps API, where restaurant reviews will be collected automatically, processed through the same machine learning pipeline, and visualized in an interactive dashboard. This proof of concept provides the foundation for that larger project and will allow me to focus on working with real-world data rather than learning the fundamentals from scratch.
Final Conclusion
This proof of concept achieved its primary objective: understanding the complete workflow behind a text classification model. Beyond building a Logistic Regression classifier, the project provided practical experience with feature engineering, model evaluation, and interactive visualization. These concepts will serve as the foundation for future projects involving real-world data and more advanced machine learning techniques.


