
As part of the Google Data Analytics Certificate, I completed a full data analytics project using real-world bike-share data. The objective of this case study was to apply the end-to-end analytics process, including problem definition, data preparation, exploratory analysis, data visualization, and the development of business recommendations supported by data insights.
This project analyzes rider behavior to identify opportunities to convert casual riders into annual members.
Business Case
The project presents a scenario in which I work as a Data Analyst on the Marketing Analytics team for a bike-share company based in Chicago. The Director of Marketing has identified that the company’s long-term success depends on increasing the number of annual memberships. Therefore, the objective is to understand how casual riders and annual members use the bikes differently. Based on these insights the team will design a new marketing strategy to convert casual riders into annual members. Every recommendation must be backed up with compelling data insights and professional data visualizations.
The goal is to design marketing strategies aimed at converting casual riders into annual members. In order to do that, it is important to understand how annual members and casual riders differ, why casual riders would buy a membership, and how digital media could affect their marketing tactics. We will use historical bike trip data to identify trends.
Data Architecture
The following data flow diagram illustrates how data moves through the reporting pipeline, from data preparation to visualization.
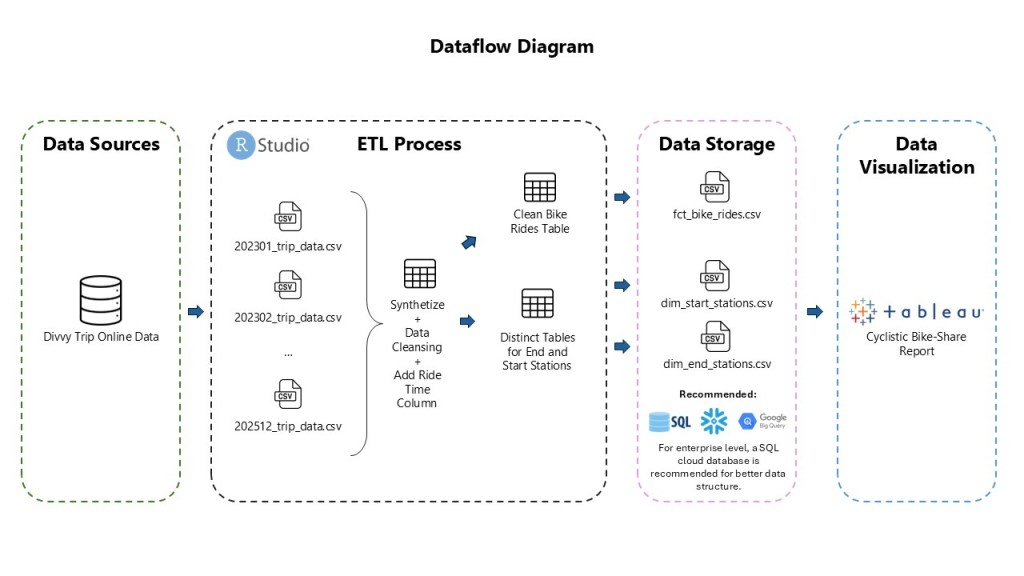
Data Analytics Tools
The tools used in this data workflow are:
- R / R Studio for data preparation. Click this link to view the code.
- CSV files: CSV files were used to store the prepared datasets. In an enterprise environment, a SQL-based database would typically be recommended instead.
- Tableau: Used for data visualization and insights detection. Click this link to view the report.
Data Sources
The data comes from an index updated every month. For this project’s scope, the data is limited from January 2023 up to December 2025. This amount of data is enough to detect trends and have a clear understaing of the project needs.
You can get to the data source using this link.
Data Storage
Considering that the project has a defined scope of time, I decided to store the data into CSV files to connect to the data visualization tool (Tableau).
My recommendation in an enterprise -level situation is to have a cloud data warehouse, a few examples that could work fine for this is Snowflake, Microsoft Azure, Google BigQuery to have a SQL based database and pull the data to Tableau.
If a cloud database is used, the R script could be adjusted to automatically extract, transform, and load (ETL) the data into the warehouse.
Entity Relationship Diagram
For the ER Diagram, I defined three tables, divided by the fact and dimension tables to have a clear vision of what to see and how to use it.
Fact Tables:
- fact_bike_rides.csv: table that contain all of the detail of the rides containing details as Ride ID, Bike type, start and end time, start and end station id. This table is connected to both dimension tables.
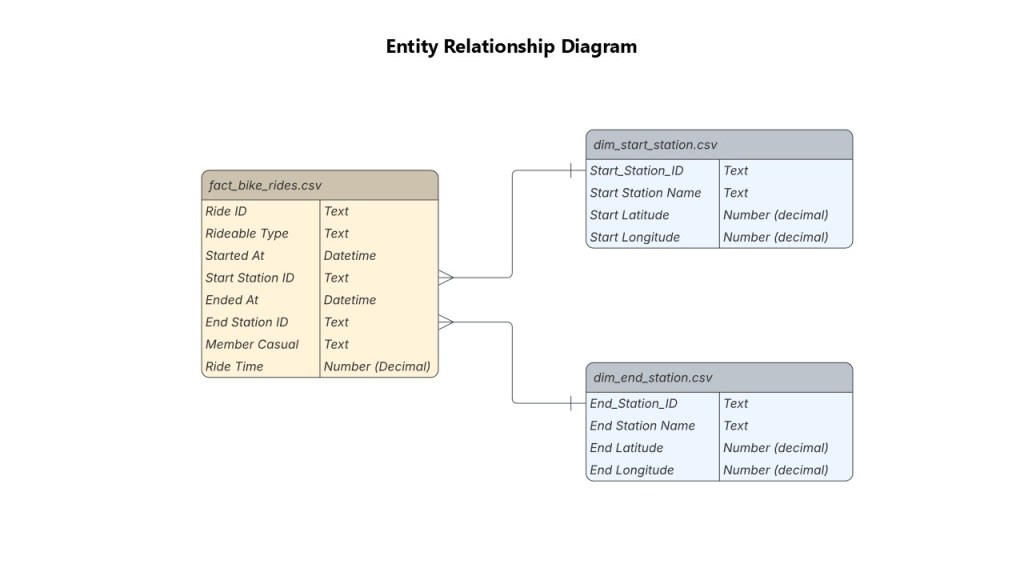
Dimension Tables:
- dim_start_station.csv: table that contains the Station ID, Station Name, and coordinates only for the start stations.
- dim_end_station.csv: table that contains the Station ID, Station Name, and coordinates only for the end stations.
KPI Framework
The dashboard focuses on the following key performance indicators (KPIs). These KPIs provide a clear comparison between the behavior of the two user types.
- Total Rides: the total count of rides that can be calculated in a certain period of time.
- Ride time: time each ride lasted from the moment it starts until the end of the ride.
Additionally, this two metrics can be broken by each of the data dimensions that the dataset provides. These dimensions are:
- Started Date: (Year/Month/Day/Hour)
- User Category: (Member or Casual user)
- Bike Type: (Classic Bike / Electric Bike / Docked Bike / Electric Scooter)
Dashboard
A Tableau Dashboard has been created to present the data visually and be able to detect key insights that are able to help us with the objective of converting casual users into members. If you want to take a look into the report you can click this link.
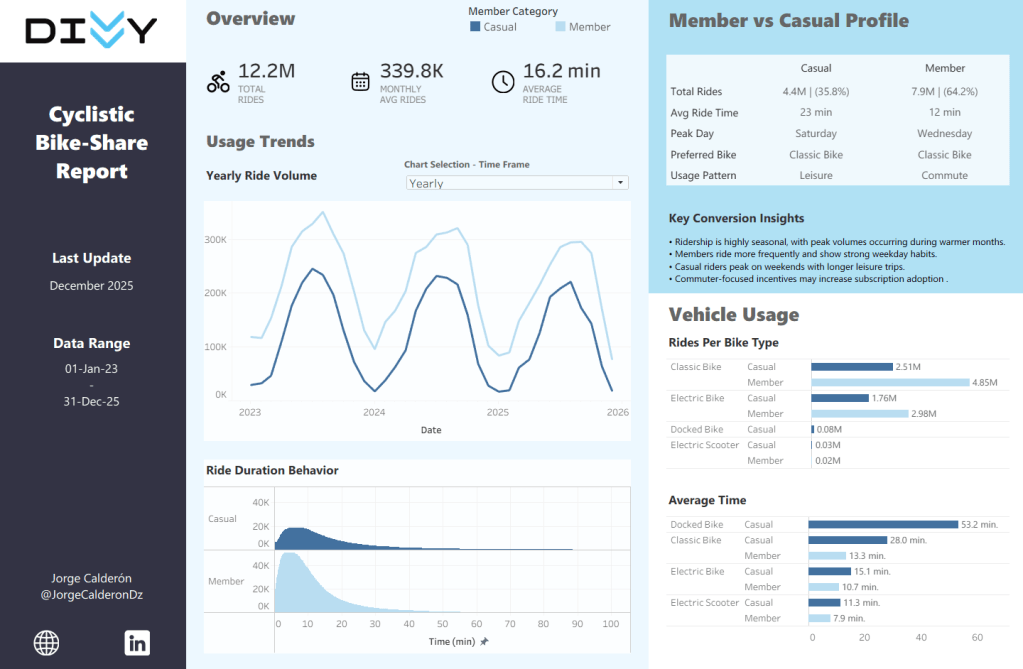
After preparing the data and building the dashboard, the next step was to analyze rider behavior patterns to identify insights that could support the business objective of converting casual riders into annual members.
Key Insights
Based on the analysis, several important behavioral patterns emerge. There are four main insights that are key to understand how the users are behaving and why.
Seasonality
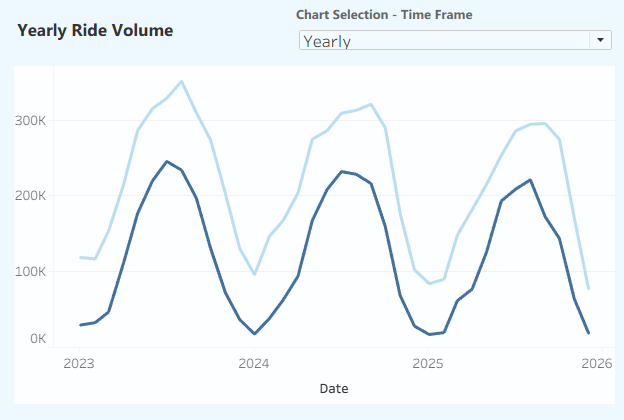
Ride demand shows a strong seasonal pattern driven primarily by weather conditions. Over the three-year period analyzed, ride activity peaks during the summer months when temperatures are warmer and outdoor mobility increases.
During these months, total ride volume increases by approximately 78% compared to winter periods, highlighting the significant influence of climate on bike-share usage. Chicago’s cold winter conditions reduce outdoor mobility, leading many users to shift toward alternative transportation options.
This seasonal trend is observed across both casual and member riders, indicating that weather conditions influence overall system demand rather than a specific user segment.
User Profile
Clear behavioral differences exist between casual riders and annual members. Weekly ride patterns reveal that members ride more frequently during weekdays, suggesting that the service is primarily used for commuting purposes, such as traveling to and from work.
In contrast, casual riders show higher ride activity during weekends, indicating that they are more likely to use the service for leisure and recreational trips.
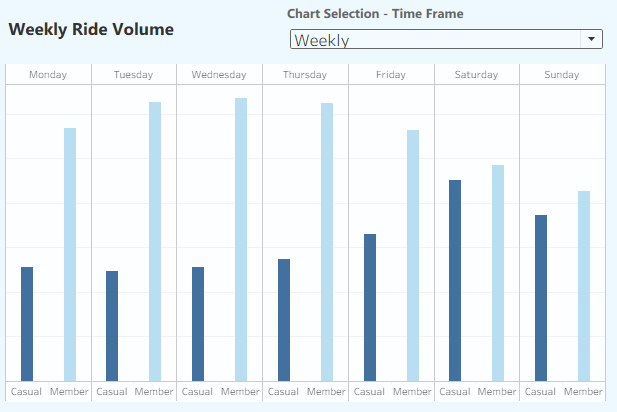
This distinction highlights two different use cases within the platform:
- Members: transportation and daily commuting
- Casual riders: leisure, tourism, and recreational activities
Understanding these behavioral differences is critical for designing targeted strategies that encourage casual riders to transition into annual members.
Ride Behavior
Ride duration and time-of-day usage reveal clear differences between casual riders and annual members.
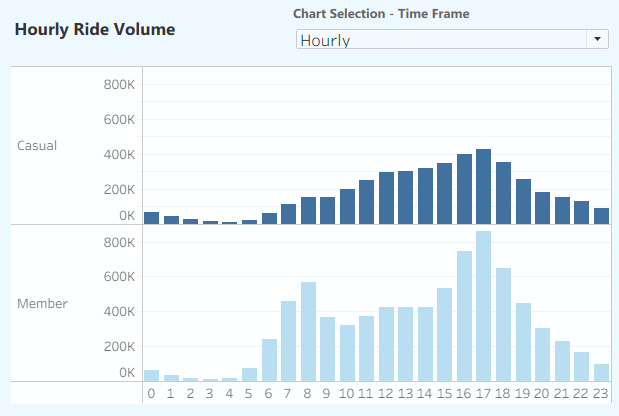
The hourly ride volume chart shows that casual riders gradually increase activity throughout the day, with peak usage occurring during the late afternoon and early evening hours (around 4 PM – 6 PM). This pattern suggests that casual users are more likely to ride after work hours or during leisure time.
In contrast, member riders show stronger activity during traditional commuting hours, with noticeable increases in the morning (around 7 AM – 9 AM) and late afternoon (around 4 PM – 6 PM). This pattern aligns with typical work schedules and supports the idea that members use the bike-share system primarily for daily transportation and commuting purposes.
Trip duration patterns further reinforce this behavioral difference. Casual riders tend to take longer rides with a wider distribution of trip lengths, indicating that their usage is more recreational or exploratory in nature. Member trips, on the other hand, are shorter and more concentrated, suggesting more direct and purpose-driven travel.
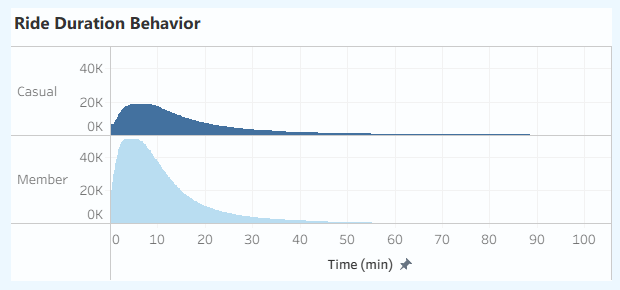
Together, these patterns indicate that casual riders treat the service as a leisure activity, while members integrate it into their daily mobility routines.
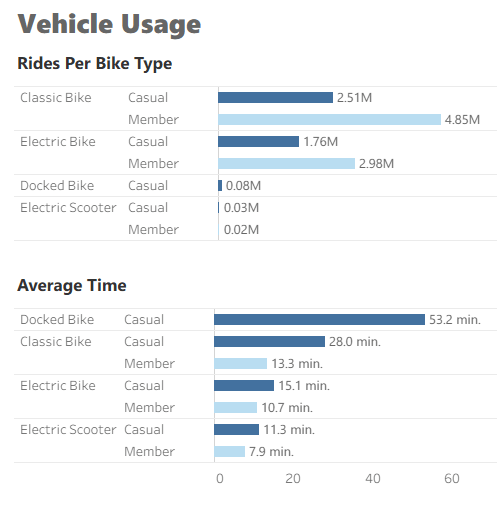
Vehicle Preference
Across both user segments, classic bikes represent the most commonly used vehicle type, accounting for the majority of rides. This suggests that traditional bikes remain the core offering of the bike-share system and meet the needs of most users.
Electric bikes also show strong adoption, particularly among casual riders. The convenience and reduced physical effort associated with electric bikes likely make them more attractive for longer or recreational trips, which aligns with the behavioral patterns observed among casual users.
Two additional vehicle types appear in the dataset but with limited usage. Docked bikes were primarily used during the early months of 2023, after which no significant ride activity was recorded for this category. This suggests that the system likely transitioned away from docked bikes during the analyzed period.
Similarly, electric scooters appear only briefly in the dataset, with ride activity recorded during a short period in 2024. The limited presence of this vehicle type suggests it was likely introduced as a temporary pilot or experimental deployment rather than a fully integrated transportation option.
Understanding these vehicle preferences is valuable for fleet management and operational planning, as it helps identify which vehicle types generate the highest demand and where investment or expansion may be most effective.
Recommendations
Based on the behavioral patterns identified in the analysis, several opportunities emerge to improve user engagement and increase the conversion of casual riders into annual members. The following recommendations focus on leveraging differences in ride patterns, seasonality, and vehicle preferences to better align marketing strategies and operational decisions with user behavior.
1. Develop Weekend-Focused Membership Promotions
Since casual riders show the highest activity on weekends and tend to use bikes for leisure trips, targeted promotions during these periods could encourage them to consider a membership plan. Offering weekend-specific discounts or trial memberships could introduce casual riders to the benefits of becoming annual members.
2. Introduce Commuter Incentives
Members show strong weekday commuting patterns, particularly during morning and afternoon hours. Encouraging casual riders to adopt similar commuting behavior could increase membership adoption. Incentives such as discounted rides during weekday peak hours or free ride credits for consistent weekday usage could help shift casual riders toward commuter habits.
3. Promote Electric Bike Accessibility
Electric bikes are widely used across both user segments and appear particularly attractive for longer trips. Increasing the availability of electric bikes in high-demand areas could improve user satisfaction and encourage more frequent use among casual riders.
4. Seasonal Marketing Campaigns
Ride activity increases significantly during warmer months. Launching membership promotions at the beginning of the spring and summer seasons could capture riders when demand is naturally increasing and when casual users are most active.
Executive Action Plan
To effectively convert casual riders into annual members, the organization should focus on three strategic initiatives over the next operational cycle and one option that needs further evaluation.
Launch Seasonal Conversion Campaigns
At the start of the high-demand riding season (spring and early summer), the company should introduce marketing campaigns promoting the long-term value of membership. These campaigns should focus on the convenience and cost savings associated with commuting and frequent riding.
Implement Behavior-Based Incentives
Using ride behavior data, the company can identify casual users who ride frequently during weekends or peak seasons. Personalized offers such as membership trials, ride credits, or discounted subscription rates could be delivered to these users through the mobile application or email marketing.
Optimize Fleet Allocation
Fleet distribution should prioritize the most frequently used vehicle types, particularly classic and electric bikes. Ensuring availability in high-demand areas during commuting hours and weekend leisure periods will improve user experience and support increased ridership.
Evaluate Emerging Mobility Options
Short pilot programs—such as the electric scooter test observed in the dataset—should continue to be explored as potential growth opportunities. However, these initiatives should be evaluated carefully to determine long-term viability and alignment with user demand.
Limitations and Further Analysis
While the dataset provides valuable insights into rider behavior, several limitations should be considered. The analysis focuses primarily on ride activity patterns and does not include demographic information such as rider age, income level, or tourism-related activity, which could provide deeper insight into user motivations.
Future analysis could explore additional dimensions such as station-level demand, ride distance patterns, and geographic clustering of high-usage areas. Incorporating external factors such as weather conditions, tourism trends, and public transportation usage could also improve the depth and accuracy of the behavioral insights.
Project Resources
If you would like to explore the project in more detail, the following resources are available:
- Tableau Dashboard – Interactive visualization of the analysis
- R Script – Code used for data preparation and transformation
- Dataset – Original data source used in the project
